Tweaking data is a constant effort here at GameRefinery, and we are always delighted to do so based on user feedback! Since launching Market Trends, we have heard the same suggestion multiple times: MORE DATA!
Our data scientists can never decline a challenge, and thus we are happy to announce that we have expanded our time scale all the way back to 2018!
What this means in practice is that you are now able to see feature popularities all the way back to the point we started collecting them. Six years of historical data and feature popularities and breakdowns are now at your fingertips!
Let’s take a dive down this memory lane!

Market Trends
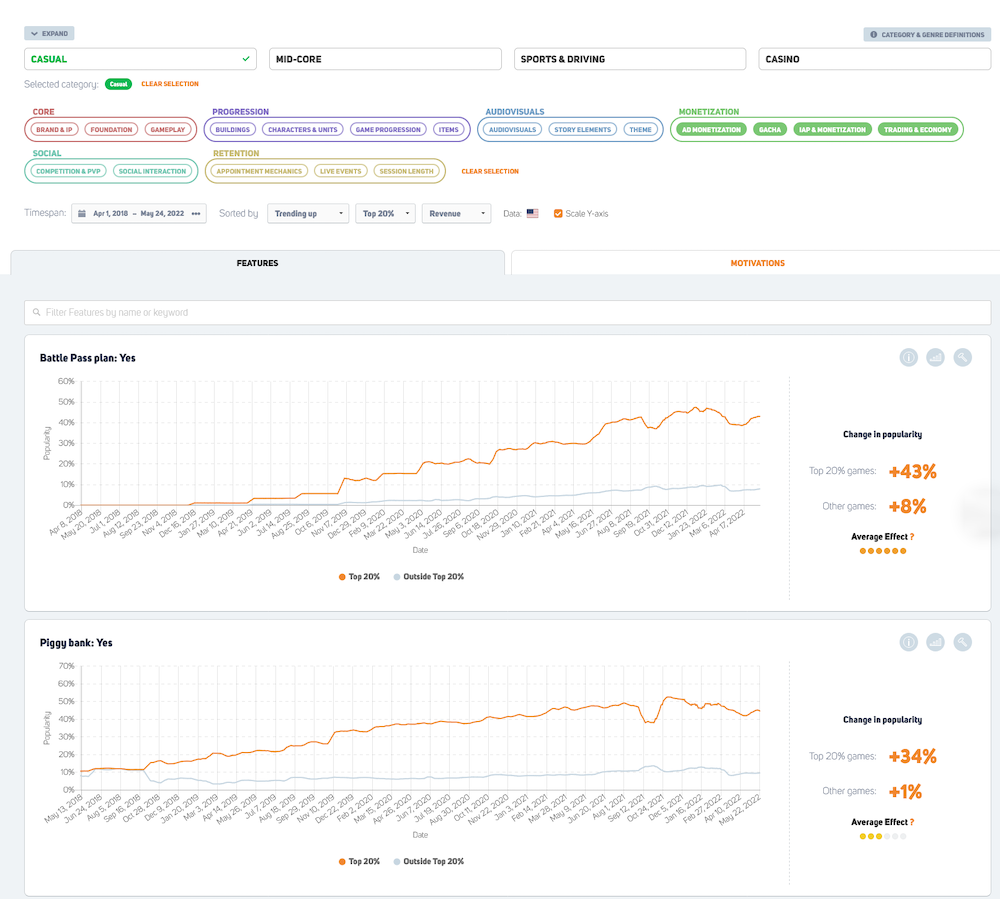
With six years of data available, this gives a completely new perspective to the timespan function in Market Share. Take an example, the rise of Battle Pass’ popularity and other monetization features in Casual games over the years.

It took three steps to set up this query:
- Select the category, genre, or subgenre we are interested in
- Select the feature groups – In this case, monetization
- Set the timespan – I chose April 1st, 2018 – May 24th, 2022
This is only an example, so in other words, we can mix these filters as we see fit! The sky’s the limit!
Feature definition tabs
You might have noticed how we have full breakdowns for all the features in GameRefinery. What these breakdown tabs have are:
- Definitions
- Facts
- Implementations
Let’s focus on the facts part!
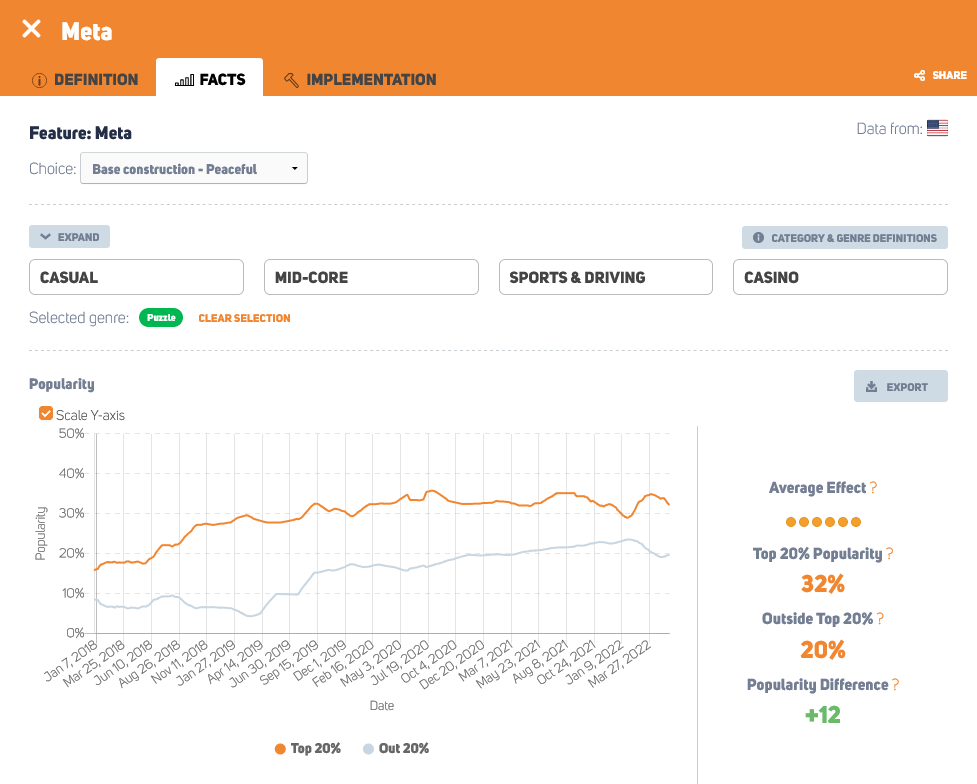
With the new historical data, we have improved the visualization of the individual features’ historical implementation and added genre taxonomy as a filter.
For example, let’s take base construction – Peaceful meta in puzzle games!

Before, you could not choose the genre or see the complete historical data of the feature. Now you can do both!
This helps you conduct your research on one page rather than hopping back and forth.
As always, this same category, genre, or subgenre-specific data is available for all the 260 features we track!
Final words
Getting feedback and suggestions keeps our data scientists and engineers busy while they help us improve the service! Thus, we are always happy to receive them. We hope that these minor tweaks to the visualization and the depth of the data make those few data scientists happy who asked about it – You know who you are. 😉
If you would like us to tweak other parts of the service or see new features, do not hesitate to send us an email or use the chat function in the service! We are always all ears!


