As publishers and developers continue to view mobile game opportunities from a global perspective, we often fall victim to the misunderstanding that mobile player preferences and behaviors are similar between regions. Akin to other forms of entertainment, such as music, television, movies and books, what is popular in one region may not be popular in another.
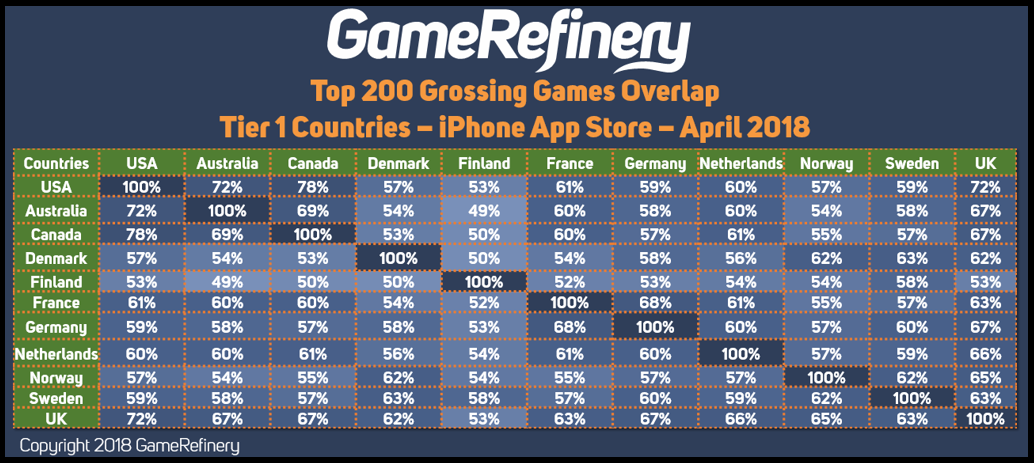
GameRefinery examined the top 200 grossing games on the iPhone App Store and provided the percentage overlap between each country. We looked at various perspectives, including between the top 100 and 500 grossing games over the last year, but results were not statistically significantly different.
Link to Spreadsheet With All Countries
Downloadable Spreadsheet

It is eye-opening to observe the overlap gap between various nations, even among Tier 1 countries, which is a group of countries that contribute the highest. We know elements such as localization, genre preferences, and geo specific user acquisition targeting all play a factor in this gap. However, one perspective that few have analyzed is whether this gap of game preferences between regions can be explained at the game mechanic level.
The soft-launch period is critical. The developer pours over incoming data and analyzes player behavior in a few regions to optimize for a global launch. However, what if the data we are receiving is misleading.
For example, let’s look at the match-3 category at the game mechanic level and examine the differences between Australia (most common soft-launch country) and the USA.
GameRefinery has analyzed over 1,600 of the top grossing games and broken each down into the presence or lack thereof of over 200 game mechanics. When dynamically regressed into an index score (i.e., PowerScore) out of 100 and correlated to gross rankings (revenues), the results indicate that over 50 percent of a game’s commercial success is attributed to the features in the game, which are the catalysts to driving our key performance indicators.
Largest Delta in Game Mechanic Impacts Between Australia and United States
Match-3 Genre
Social Media Connection
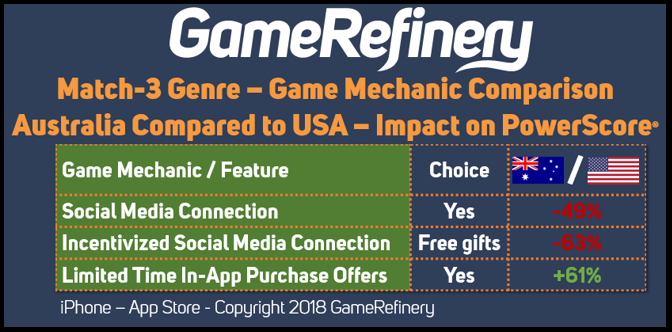
The function of being able to connect to Facebook, Line, WeChat, Twitter, etc. under-indexes by 49 percent in its contribution to the PowerScore in Australia compared to the USA. Meaning, games with this mechanic are not driving as much revenue in the USA compared to Australia, on a relative basis.
Without this perspective, a product or BI manager may interpret low conversion rates of social media connections or lower revenue generation from those that do connect as indications of a problem.
This could easily lead to an excessive amount of resource allocation to solving a problem that may only be contained to one specific region. By no coincidence, the feature of Incentivizing Social Media Connection with a free gift under-indexes by 63 percent compared to the USA.
Limited Time In-App Purchase Offers
For Australia, having players participate in limited special sales over-indexes by 61 percent in its contribution to PowerScore. Therefore, informing us that while it may seem like limited sales are contributing a lot to in-app purchases during our Australian soft-launch, it may not have as high of an impact when we launch globally. In the right hands, this allows product and BI managers to set proper KPI expectations.
These are just a few examples, but the data shows an opportunity to continue digging more into our data on a regional level. Attempting to extrapolate the results from one region into another will not generate the same impact. While game mechanics are the basic drivers of our users’ actions and dynamically changing them at a regional level is nearly impossible, at least understanding how player preferences change between regions can lead us to better informed decisions, both on the production side and in how we market our mobile games.


