Congratulations! You are approaching the inevitable soft launch of your game for which you’ve burned a fair share of midnight oil. Though to be warned, the real work begins now as you are entering the realm of LiveOps.
This is where the fun and grinding begins.
Conan, what is best in LiveOps?

GameRefinery’s Market Share offers an opportunity to study the historical performance of all the top-grossing games. Who have become rulers and who have been erased from the top-grossing ranks. The most visible data is the historical percentage share of each game per sub-genre which will help us find the necessary clues to understand the magic recipe of their LiveOps. These percentage changes can be used to pinpoint the games which have been excelling in their LiveOps through content & adding features over a set period of time.
In this tips & tricks article, we’ll take a look into the 4X strategy sub-genre. As the old saying goes,” numbers don’t lie” we’ll take the top-performing games and their one year of LiveOps under the microscope. We will do a basic analysis of how many updates they’ve had and what was included. The latest Game Update Impacts update makes analyzing content even easier now! Note that we are counting the updates and their types. To dwell deeper into the specific update content is saved for a future article. 😉
Setting time periods in Market Share
As mentioned, we’ll be taking a look into the 4X strategy subgenre – We can set the scope to genre-level to see how different subgenres have developed over time.
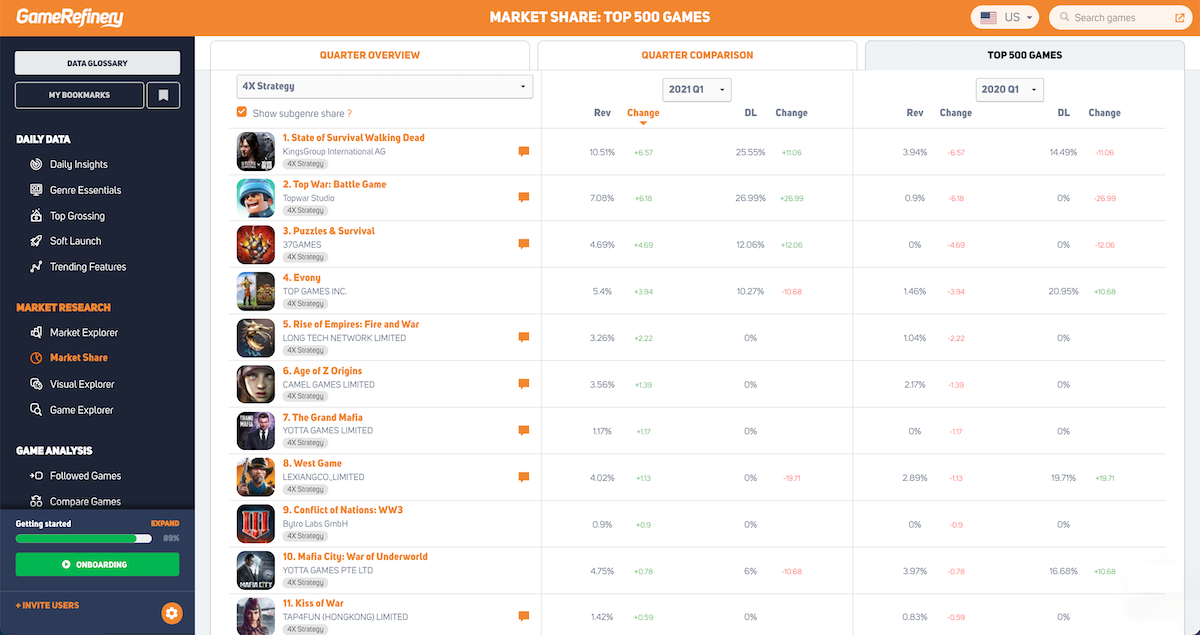
At this point, we will also mark ”Show subgenre share” checked as we want to focus purely on all 4x strategy games out there. As the latest full quarter data we have from 2021 is from Q1 at the time of writing, it’s natural that we set it as a starting point. Further, we set our comparison point to 2020 Q1 giving us one year of progress & market share data available.
We can now focus on the top 10 performing 4X strategy games and see both their revenue & download share over the past year.
Six games out of ten have increased:
- State of Survival: Zombie War – 6.57% increase
- Top War: Battle Game – 6.18% increase
- Puzzles & Survival – 4.69% increase
- Evony – 3.94% increase
- West Game – 1.13% increase
- Mafia City: War of Underworld – 0.78% Increase
To keep this article short and simple, we’ll focus on the three biggest growers: State of Survival: Zombie War, Top War: Battle Game, and Puzzles & Survival.
Game Overview Pages
Each of our three games has an update history tab on their game overview page. In this tab, we list all the updates that have been added since the game’s launch. Our definition of an update is linked to the iTunes client update.
State of Survival: Zombie War
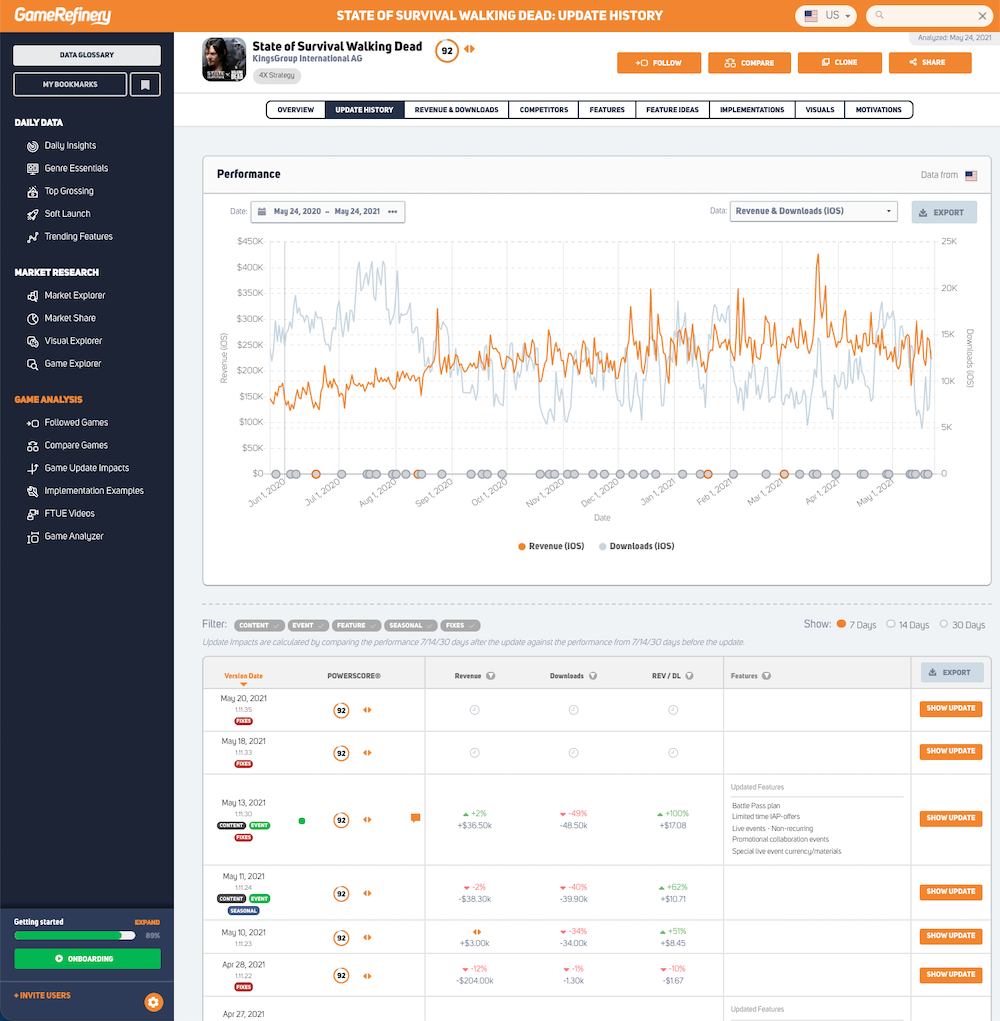
We couldn’t fit all the game updates between Q1 2020-Q1 2021 in one picture, but you can access State of Survival’s update history in the GameRefinery service here.
Let’s do the math!
Updates between Q1 2020-Q1 2021: 67
- Updates where new features were introduced: 3
- Updates where existing features were updated: 21
- Updates including events: 34
- Updates including content: 40
- Updates including seasonal: 12
- Updates including fixes: 63
Top War: Battle Game
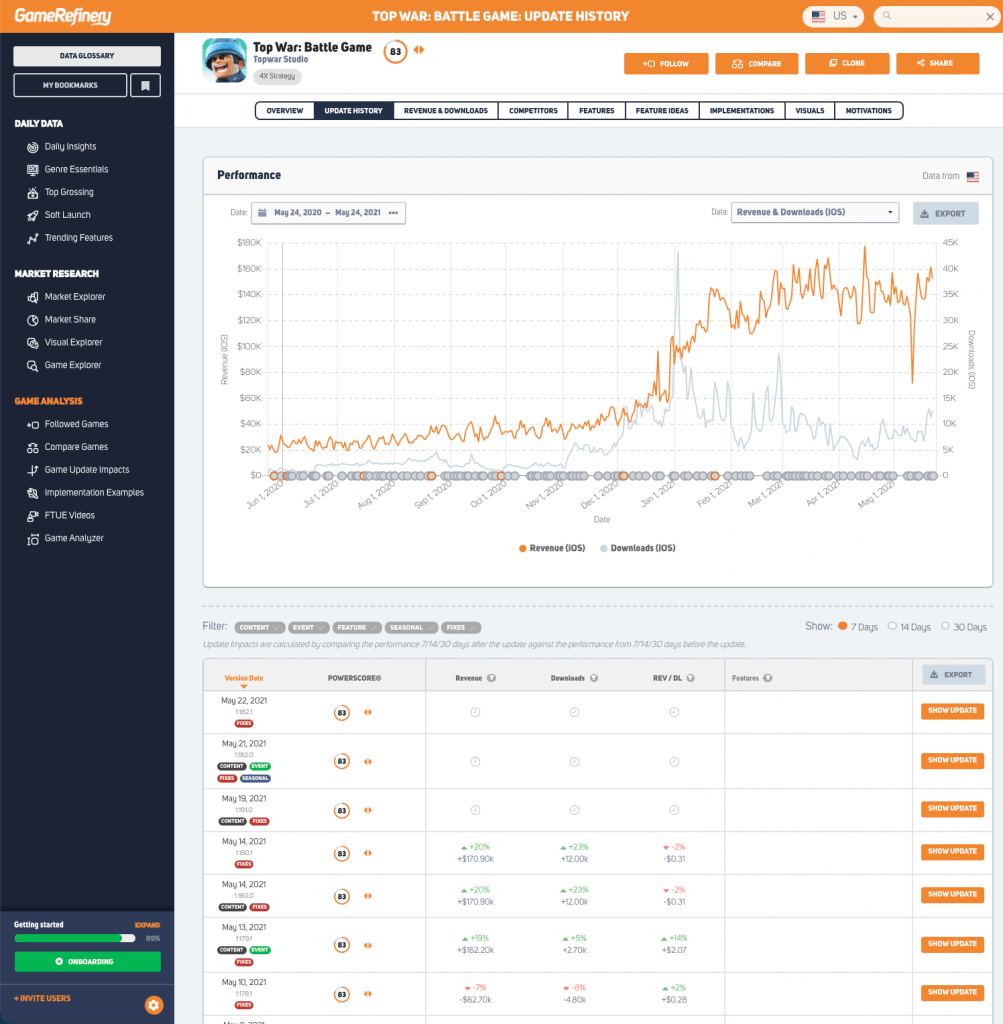
We couldn’t fit all the game updates between Q1 2020-Q1 2021 in one picture, but you can access Top War’s update history in the GameRefinery service here.
Updates between Q1 2020-Q1 2021: 162
- Updates where new features were introduced: 4
- Updates where existing features were updated: 3
- Updates including events: 21
- Updates including content: 61
- Updates including seasonal: 5
- Updates including fixes: 153
Puzzles & Survival
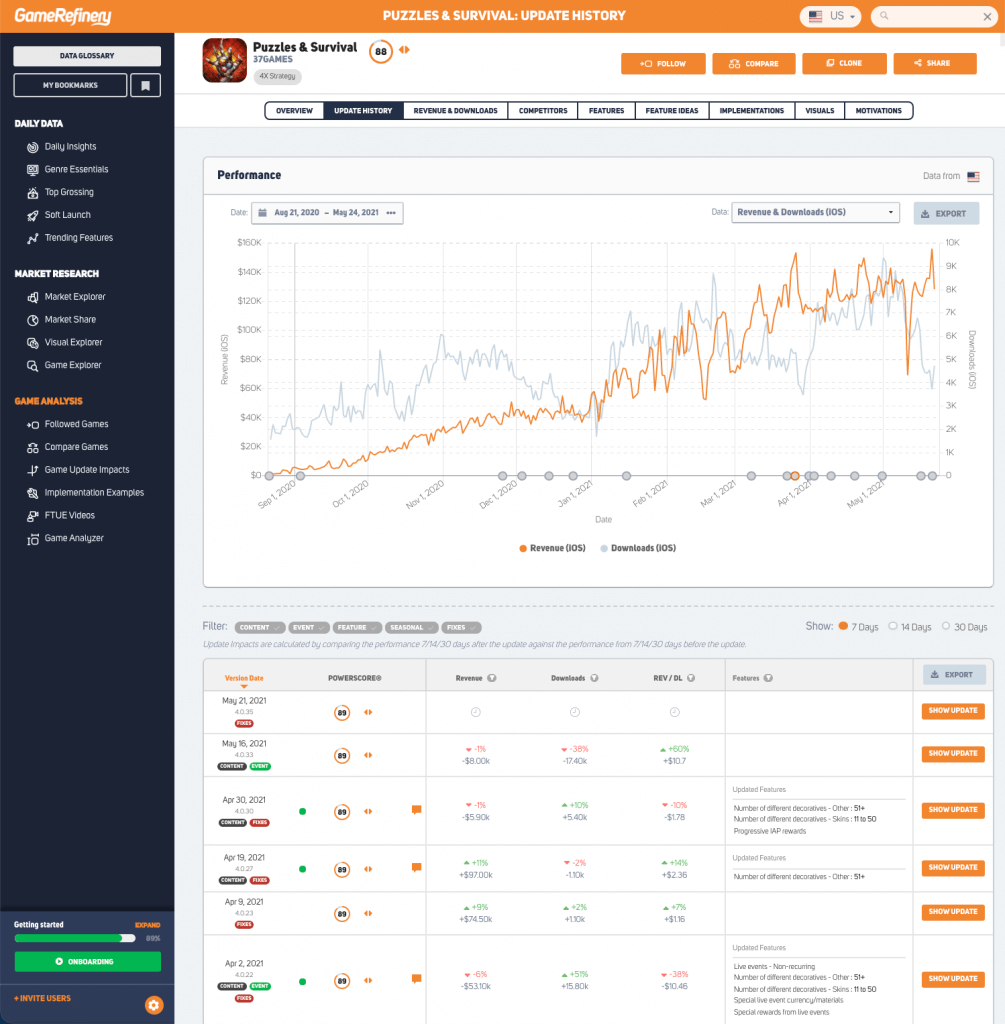
We couldn’t fit all the game updates between Q1 2020-Q1 2021 in one picture, but you can access Puzzle & Survival’s update history in the GameRefinery service here.
Updates between Q1 2020-Q1 2021: 11
- Updates where new features were introduced: 1
- Updates where existing features were updated: 6
- Updates including events: 3
- Updates including content: 8
- Updates including seasonal: 1
- Updates including fixes: 2
Summary
In conclusion, Market Share can be used to easily identify games improvements in performance and offer immediate access to Game overview pages. As our analysts are going through the updates, we also take as many screenshots and write analyst comments of what was included.
To summarize the above findings:
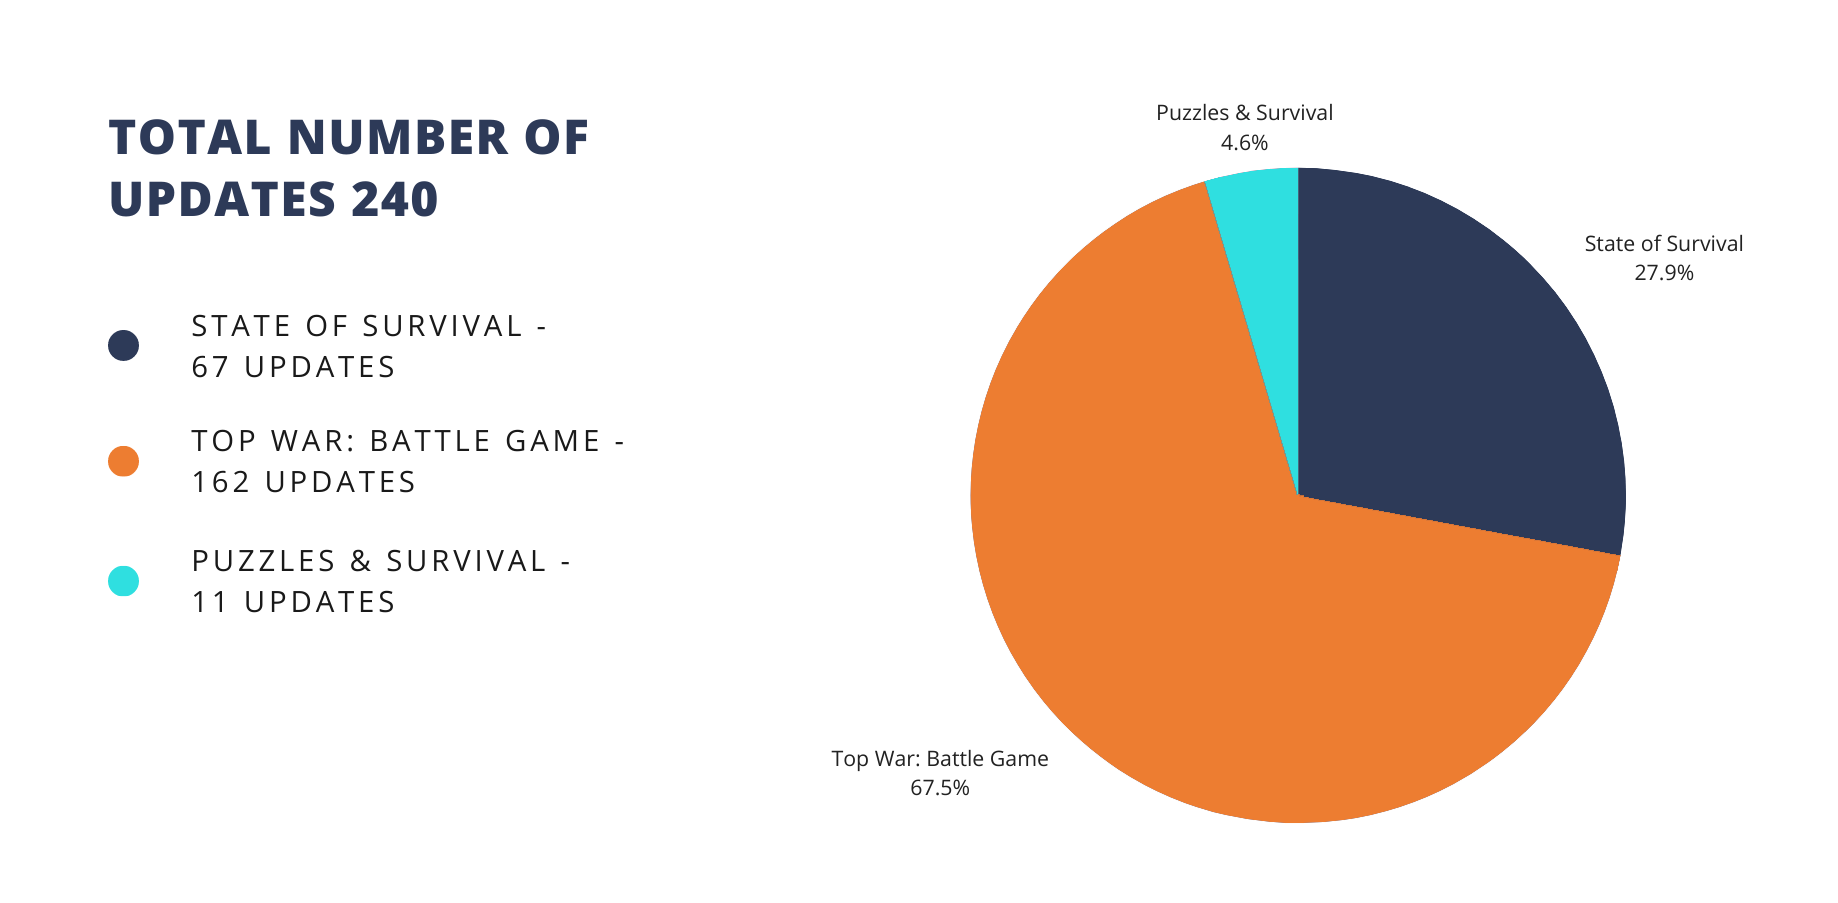
167 updates out of a total of 240, 67% included events and content, and we have screenshots available for these updates. Surprisingly not many of the games added new features as there were eight features added in total. Existing feature updates (Battle Pass, LiveOps features, etc.) accounted for 78% of the feature updates we were able to analyze! Puzzles & Survival was the last to join the party as it was released in August 2020, so keep that in mind when taking a look into its updates. 😉
As one of our users said, success is only one side of the coin. It’s also crucial to take a look into the games that have not fared that well to identify and dissect successes and understand failures.

